






Consulting for Operations and Production
Operational Excellence: Consulting for Throughput, On-Time Delivery and Stable Plants
Production optimization means extracting a more reliably deliverable volume from existing facilities, shifts, and inventory. It focuses on four key metrics: throughput, on-time delivery, inventory, and unit costs. It rarely becomes important gradually, but rather at a specific point in time—when a customer raises an escalation, a series production launch falls behind the ramp-up curve, a piece of equipment shuts down more often than planned, or the sales plan promises more than the plant can produce. This requires reliable data from the production floor, a sequence of actions that first addresses the actual bottleneck, and a control mechanism that identifies the next bottleneck early on. This is precisely what production-oriented operations consulting focuses on.

Leading companies trust our network















What Operations Consulting Delivers — and What It Does Not

Operations consulting for manufacturing — searched for as production optimization, as manufacturing consulting and, where the focus sits on workflows rather than machines, as business process improvement consulting — asks how much a plant can reliably deliver and what limits that figure. Its subject is production control, capacity, material flow and equipment availability. It starts from an observation common to every manufacturing process: at any moment there is exactly one point in a plant that limits throughput — and that point does not stay put.
It separates the bottleneck from the symptom. A delivery backlog is not a finding, it is a result. Behind it lies almost always one of four causes: a machine that does not run for the time planned; material that arrives too late; a workload that promises more than the line can deliver; or a quality problem that generates rework. On the shop floor all four feel the same.
It thinks in throughput, not in utilization. A machine that is not the limiting one produces no additional revenue when run at full capacity — it produces additional inventory, capital tied up between production steps. An improvement is therefore only an improvement where it reaches the bottleneck; everywhere else it moves the problem to a less visible place.
It makes the next bottleneck visible early. Once the limiting point is relieved, it moves on: to the next machine, to maintenance, or to planning. A plant that notices this only when the backlog starts growing again is permanently one step behind. Every measure therefore carries a figure and a date on which that figure is read.
What it does not do. It does not create capacity that physically does not exist: where demand permanently exceeds the technical limit of a site, that is an investment question. It does not replace a decision on the product portfolio — a range of variants nobody is willing to cut stays a setup problem. And it does not work past the supervisor and shift level: where the numbers are not considered correct there, no new control loop survives until the next special shift.
The organizational side — business processes, interfaces, roles and documentation — is a separate discipline; that is where classic business process improvement consulting sits, and it leads to different measures than work on the line. Questions that reach beyond the factory gate into the network, sourcing or inventory strategy belong to supply chain work. Sales & Operations Planning touches both worlds; here the plant view is the one that counts: can the site deliver what the sales plan promises?
Manufacturing by Industry: What Sets the Pace
Pressure on manufacturing is high everywhere, but capacity is not the limiting factor. In just-in-time production, line availability is the deciding factor because a single stoppage brings the entire chain to a halt. In plant and special-purpose machinery manufacturing, success is determined by scheduling individual work orders, not by production volume. In the process industry, plant operation is key; in validated manufacturing, documentation is crucial; and in food production, the transition between batches and cleaning is critical. Those who only notice this difference once a project is underway will pay for it in missed deadlines.
That is why we perform staffing of projects based on manufacturing experience, not on availability: with experts who know the standards, the typical shift models, the common sources of waste, and the points where similar projects have failed in the past. We regularly work in the following industries; each tile highlights what drives the pace in that sector and how progress is measured.


Automotive and Supplier Industry
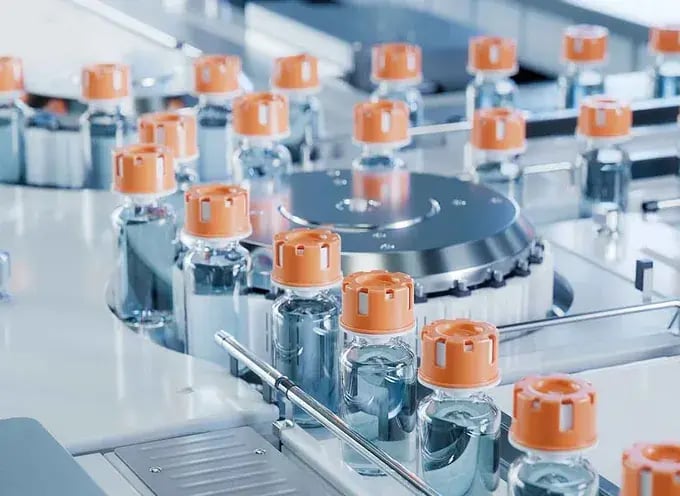
In takt-based production, a single stoppage brings the entire line to a halt, and every minute translates directly into units lost. The key to improvement rarely lies in adding more staff, but rather in the availability of critical stations, quick changeovers, and material supply that keeps pace with the takt. Added to this is the pressure from customer audits based on IATF 16949. Often, the greatest losses do not occur on the main line, but rather in pre-assembly, rework, and changeovers. Performance is measured by line availability, first-pass yield, and on-time delivery.

Machinery and Plant Engineering
Single-unit and small-batch production does not follow a takt time schedule: The order is the project, and the deadline is determined simultaneously by design, procurement, manufacturing, and assembly. Delays usually do not occur on the shop floor, but rather due to late design stages and parts that are missing only during final assembly. What is needed is a scheduling process that considers bottleneck resources—such as large-scale machining or commissioning—across all orders. Performance is measured by on-time delivery and lead time per order.


Chemicals and Process Industry
Continuous production lines do not have a piece counter: Profitability is determined by operating procedures, yield, energy consumption, and the length of production runs between product changes. An unplanned shutdown costs far more than the downtime itself, because startup and shutdown consume material and time. Progress lies in stable process parameters and in planning that bundles product changes. Performance is measured by system availability, yield, and the number of unplanned shutdowns.


Pharmaceuticals and Medical Technology
In validated manufacturing, every change is a separate project: Anything that isn’t documented and approved doesn’t exist in the eyes of the regulatory authorities. Optimization here means, first and foremost, addressing losses that do not affect the validated state: setup and cleaning times, batch documentation, and the approval process. Because the quality organization plays a role in decision-making, it must be involved in the management process from the very beginning. Performance is measured by batch cycle time, time to approval, and nonconformance rate.


Food and Beverage
Short shelf lives, seasonal peaks, and hygiene requirements make production sequencing the most critical factor: Every change in product variety or allergen triggers a cleaning cycle that takes the line out of production. Improving campaign planning yields more time than any increase in line speed. Added to this are fluctuations in raw materials and audits according to IFS or BRC standards. Performance is measured by equipment availability after cleaning, yield per batch, and on-time delivery during peak season.


Metal and Plastics Processing
In machining, metal forming, and injection molding, profit is measured in machine hours: setup time, tool life, and lot sizes determine how much productive time remains. Small batches increase flexibility but also erode it if setup time is not systematically reduced. Often, there is no reliable record of which machine was idle and why—without it, the discussion about investment becomes a matter of opinion. Performance is measured by the percentage of productive time, setup time per changeover, and scrap rate.
Automotive and Supplier Industry
In takt-based production, a single stoppage brings the entire line to a halt, and every minute translates directly into units lost. The key to improvement rarely lies in adding more staff, but rather in the availability of critical stations, quick changeovers, and material supply that keeps pace with the takt. Added to this is the pressure from customer audits based on IATF 16949. Often, the greatest losses do not occur on the main line, but rather in pre-assembly, rework, and changeovers. Performance is measured by line availability, first-pass yield, and on-time delivery.
Machinery and Plant Engineering
Single-unit and small-batch production does not follow a takt time schedule: The order is the project, and the deadline is determined simultaneously by design, procurement, manufacturing, and assembly. Delays usually do not occur on the shop floor, but rather due to late design stages and parts that are missing only during final assembly. What is needed is a scheduling process that considers bottleneck resources—such as large-scale machining or commissioning—across all orders. Performance is measured by on-time delivery and lead time per order.
Chemicals and Process Industry
Continuous production lines do not have a piece counter: Profitability is determined by operating procedures, yield, energy consumption, and the length of production runs between product changes. An unplanned shutdown costs far more than the downtime itself, because startup and shutdown consume material and time. Progress lies in stable process parameters and in planning that bundles product changes. Performance is measured by system availability, yield, and the number of unplanned shutdowns.
Pharmaceuticals and Medical Technology
In validated manufacturing, every change is a separate project: Anything that isn’t documented and approved doesn’t exist in the eyes of the regulatory authorities. Optimization here means, first and foremost, addressing losses that do not affect the validated state: setup and cleaning times, batch documentation, and the approval process. Because the quality organization plays a role in decision-making, it must be involved in the management process from the very beginning. Performance is measured by batch cycle time, time to approval, and nonconformance rate.
Food and Beverage
Short shelf lives, seasonal peaks, and hygiene requirements make production sequencing the most critical factor: Every change in product variety or allergen triggers a cleaning cycle that takes the line out of production. Improving campaign planning yields more time than any increase in line speed. Added to this are fluctuations in raw materials and audits according to IFS or BRC standards. Performance is measured by equipment availability after cleaning, yield per batch, and on-time delivery during peak season.
Metal and Plastics Processing
In machining, metal forming, and injection molding, profit is measured in machine hours: setup time, tool life, and lot sizes determine how much productive time remains. Small batches increase flexibility but also erode it if setup time is not systematically reduced. Often, there is no reliable record of which machine was idle and why—without it, the discussion about investment becomes a matter of opinion. Performance is measured by the percentage of productive time, setup time per changeover, and scrap rate.
From Plant Management to Maintenance: Which Profiles Get Staffed








From the Plant Walk to the Control Loop: How It Runs
The scope and duration of the steps depend on the size of the plant, the type of production, and the available data, but the sequence does not: first observe, then measure, then remove the bottleneck, then secure it. No step is skipped; steps are shortened only when reliable preliminary work has been done.

1. Plant Walk and Baseline Assessment

2. Loss Analysis and Bottleneck Identification

3. Prioritizing Measures and Setting Targets

4. Implementation on the Shop Floor

5. Measuring Impact and Adjusting

6. Handover and Routine Operation
-

€1,200 – €1,900 per day
-

€1,100 – €1,700 per day
-

€900 – €1,500 per day
-

€700 – €1,320 per day
-

Freelance Six Sigma Black Belt
€750 – €1,300 per day
-

€750 – €1,300 per day
-

€820 – €1,150 per day
-

Freelance Process Improvement Manager
€650 – €1,100 per day
Excellent. We are not the only ones who think so.
consultingheads has received several awards from leading trade magazines and independent third parties.




.png?width=260&height=392&name=consultingheads-kununu-top-company-2023%20(1).png)